Machine Learning (ML) for Time & Price Projection
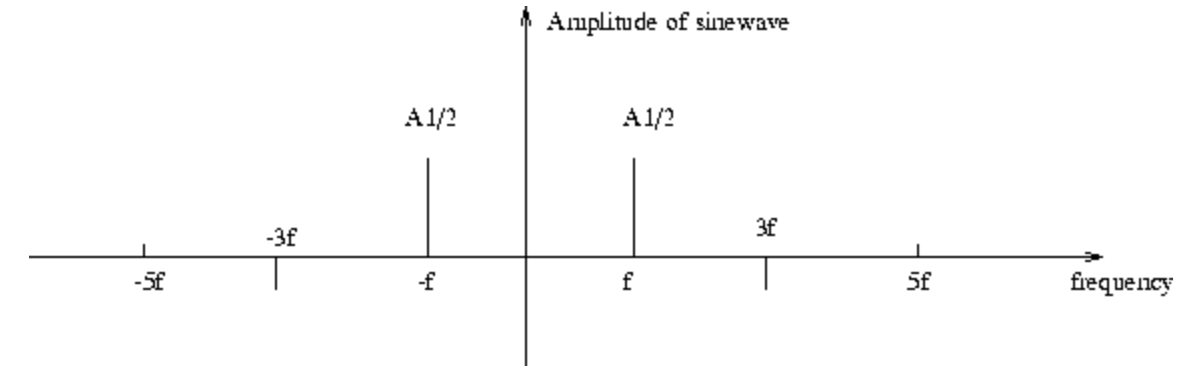
At a high level the computation of the cyclical regression starts with the idea similar to that of a Fourier transform which is a mathematical function that transforms a timeseries from the time domain to the frequency domain. This is a very powerful transformation which gives us the ability to understand the harmonics that are inside the underlying data. Complex signals made from the sum of sine waves are all around us and that includes stock market dataseries. In fact, all signals in the real world can be represented as the sum of sine waves, and this is where the marriage of cyclical regression along with the computation of the underlying dominant harmonics of any financial instrument starts to make sense in order to uncover alpha, but not yet and one still has to extend that matrix into a time projection. This is where the world of machine learning comes into play in order to generate and document projections across all kinds of timeframes, instruments, and asset classes.
As an example of what the Fourier-like Hedgtrade transform model does, let's look at the two graphs below:
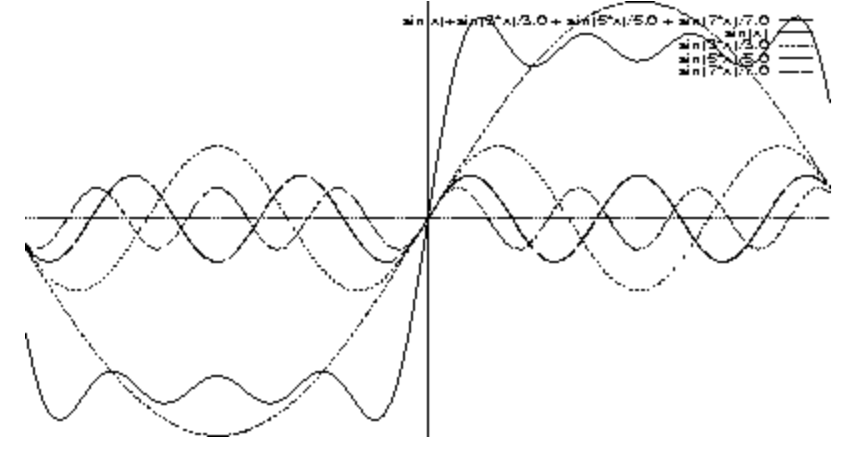
One of the key steps is to break down the market data series into its own underlying dominant oscillating components.
And to finally filter it by its most dominant harmonics in order to feed the machine learning projection model
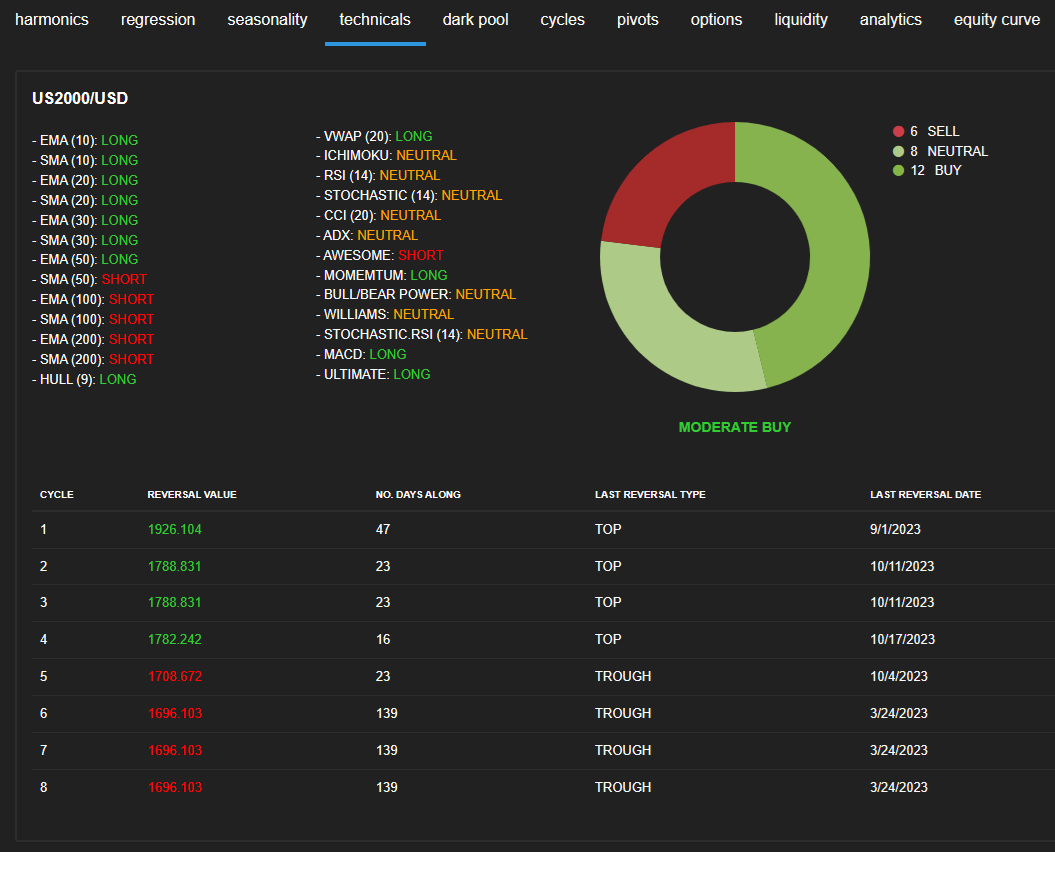
And the result of that is a projection into the future that correlates with the underlying matrix, given all things being equal and updated in real time by the quant platform - example below of a projection with the Russell 2000 going into the next couple of weeks along with the thought process that it's all about building the sum of the evidence from a statistical point of view along with Hedgtrade's supporting models including but not limited to seasonality (aggregated, decennial, election, day of month, etc), order book stats, liquidity models, technicals (momentum & trends), VIX projection, US dollar projection, and so on...
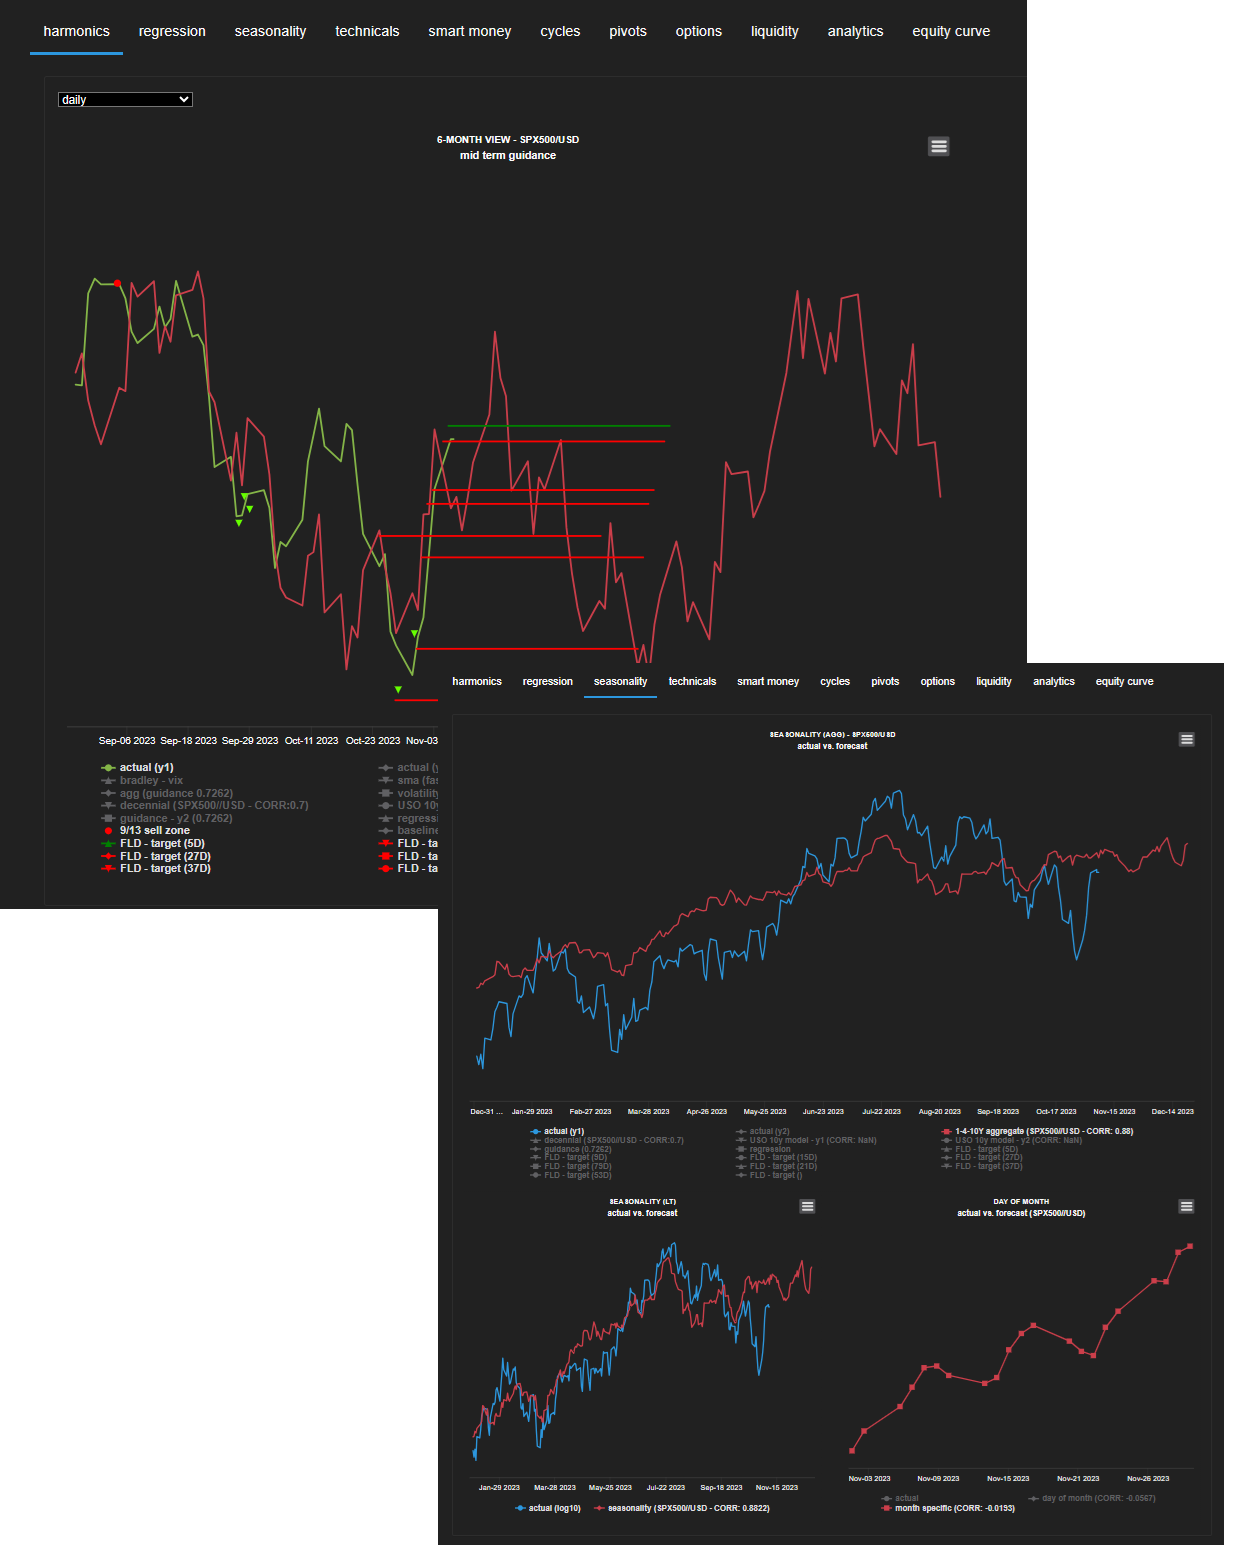
Among other data points, the regression model also offers points of reversals for placing T/Ps and S/Ls alongside its technical trends and momentum metrics hence supporting the overall thought process for the investor to build the sum of the evidence and have a statisitcal bias that's removed from any emotion or as some would call it FOMO among other reactions to market movements